

Best
Twitter Analytics
Tools for X in 2026
Published · Last updated
You pull up your X Analytics tab, stare at a row of numbers, and close it five minutes later without changing a single thing about how you post. Impressions went up. Engagement rate dipped. Followers... maybe gained a few? Hard to tell what caused it.
That ritual plays out every week for most creators and founders on X. The data is there. The system for acting on it is not. And when you go looking for a third-party tool to fill the gap, you hit a wall of enterprise dashboards built for 20-person social teams, lightweight browser widgets that show a follower ticker and stop there, and listicles that rank 16 tools without explaining what any of them actually help you DO differently.
This post takes a different approach. First, I'll walk through the metrics that genuinely drive growth for solo creators and founders on X, with a framework you can run in 15 minutes every Monday. Then we'll compare the analytics tools worth looking at in 2026, organized by the job they do. And because data only matters when it changes what you publish, I'll show where Ghosti fits into the workflow at the end.
The Metrics That Actually Move the Needle on X
Open any Twitter analytics dashboard and impressions are the first number you see, which is why most creators default to tracking them. Impressions feel validating. They also tell you almost nothing useful about whether your content converts attention into an audience.
Here's what to track instead.
Profile visits and follow rate
These are conversion metrics. A post that racks up 50,000 impressions but sends zero people to your profile entertained a crowd that kept scrolling. A post with 3,000 impressions and 40 profile visits pulled the right readers toward your account. The ratio of profile visits to impressions, tracked over a rolling two-week window, shows whether you're reaching your people or just passing through feeds.
X's native analytics dashboard surfaces post-level metrics such as impressions and engagement. Most creators hit the same wall from there: connecting a specific post to the follows it actually generated is hard with native tools alone, and that gap is where a dedicated analytics tool earns its money.
Engagement quality, not engagement volume
X provides metrics for views, reposts, likes, and replies. That aggregate is noisy. What matters is separating replies and quote posts from the rest. Replies signal that someone stopped scrolling long enough to type something back. Quotes mean your idea was worth building on. Both of these are among the engagement prediction signals described in the X open-source algorithm repository, which the For You ranking model uses when scoring posts.
Likes are fine. But a post with 200 likes and 2 replies performed differently than a post with 30 likes and 25 replies. Track them separately.
Follower conversion by format
Start tagging your posts by format, even informally: standalone post, thread, reply, meme, news reaction. After three to four weeks, compare which formats generate the most profile visits and follows per impression. In practice, most creators find that one or two formats carry the weight while the rest fill the calendar. Knowing which formats convert lets you double down instead of guessing.
Tip: X Analytics provides post-level metrics such as impressions and engagements, but does not appear to break performance down by individual post format. A dedicated analytics tool earns its value when it connects specific posts to actual follower growth, not just impressions.
A 15-Minute Weekly Analytics Review
You don't need to become a data analyst. You need a short, repeatable check-in that turns numbers into one clear action. Here's a framework that takes about 15 minutes each Monday.
- Pull your top 5 posts by profile visits (not impressions) from the past 7 days. What did they share? Topic, format, tone, time of day? Look for the pattern, not the outlier.
- Check reply performance separately. Which replies you left on other people's posts drove profile clicks back to you? Many creators find that replies on mid-sized accounts in their niche convert better than replies on massive accounts where your comment gets buried in hundreds of others.
- Compare this week's follower count to last week's. Not for the ego. For the trend. Flat growth despite high impressions means your content entertains but doesn't convert. Rising follows with modest impressions means you're reaching the right people.
- Pick one adjustment. Not five. One. More threads this week. Shorter posts. Replies in a different niche pocket. Focused testing is the only kind that teaches you anything.
- Log it. One line: "Week of July 14: threads drove 3x profile visits vs. standalone. Doubling thread output next week." Four weeks of this and you have a content strategy built on your own data.
This review works with X's built-in analytics. A paid tool can add depth, but the habit of reviewing matters more than the dashboard you use.
Four Jobs an Analytics Tool Does
Before looking at specific tools, get clear on what you're actually hiring one to do. For creators and founders growing on X, the work breaks into four buckets.
Content optimization
Which posts perform, which formats work, and when your audience is most active. This is the baseline every decent analytics tool covers. The real differentiator is whether the tool connects post-level data to follower growth or just shows impressions in a prettier chart than X does natively.
Audience intelligence
Who follows you, what else they follow, what they talk about. This is where dedicated audience-intelligence platforms justify their price. Knowing your audience's other interests gives you topic ideas you'd never come up with staring at your own feed.
Competitor benchmarking
How your engagement rate, follower growth, and posting cadence compare to similar accounts in your niche. Useful for calibrating expectations and spotting content gaps. If three accounts your size are growing faster and they all post threads twice a week while you post zero, that's a signal.
Sentiment and brand monitoring
Tracking mentions, keywords, and how people talk about your brand or product. More relevant for companies and product builders than solo creators, but critical if you're running a launch or managing a community.
Most solo creators and indie hackers need content optimization and light audience intelligence. Enterprise teams need all four. Pick the tool that fits the job you're doing today.
The Best Twitter Analytics Tools in 2026
Now the tools themselves. These are grouped by the job they do rather than ranked one through ten, because the honest answer for most solo creators is that you need one of these, not four.
X's own analytics
Start here, and be honest with yourself about whether you have actually outgrown it. X Analytics gives you an account overview plus post-level impressions and engagement, free, with nothing to install. For the Monday review above, it genuinely does the job. Where it runs out of road is connecting a specific post to the follows it produced, and breaking performance down by format.
BlackMagic: in-X analytics and a personal CRM
BlackMagic is an X analytics and CRM extension that runs inside X. Pricing: free plan; paid from $16.25 / month (billed yearly). It is close to a power-user version of the framework at the top of this post: real-time tweet analytics, follower and engagement tracking, and a CRM layer for keeping track of the people you are actually building relationships with.
One caveat before you install it. Chrome Web Store reviewers report the extension as broken or stale, with the banner and sidebar not working and slow support, and there is little recent update activity. Read the current reviews before you pay for a year.

TweetDeck (X Pro): monitoring, not measurement
TweetDeck is a column-based X monitoring dashboard, now called X Pro. Pricing: requires X Premium+ (about $40 / month). You get multiple timelines, lists, searches, and mentions side by side, and because it is made by X there is no third-party connection to worry about.
But monitoring and analytics are different jobs. X Pro shows you what is happening right now; it does not tell you what worked last week or why. As of March 2026 it also sits behind the roughly $40/month Premium+ tier, a steep jump from the old $8 Premium, which is what sent a wave of people looking for alternatives in the first place.
Circleboom: account management with analytics attached
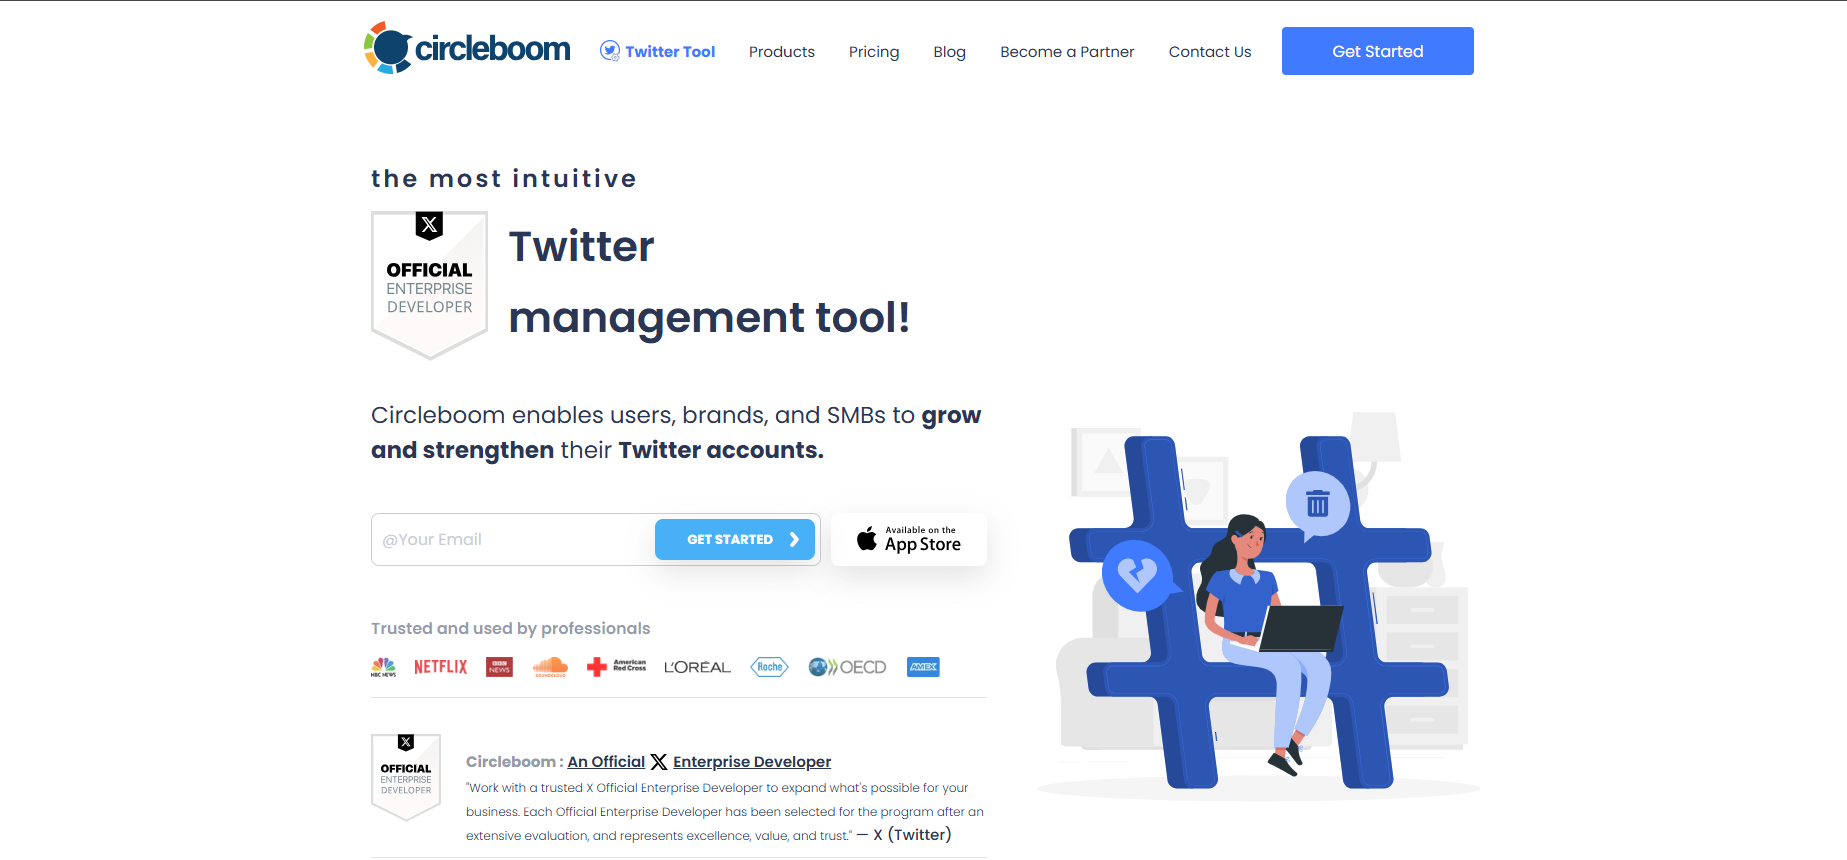
Circleboom is an X management tool and multi-platform scheduler. Pricing: from $12.99 / month (Twitter Management). Follower audits, fake-follower detection, mass unfollow, and bulk tweet deletion, plus analytics and scheduling across around ten networks. If your real problem is "my follower list is full of bots and my old tweets are embarrassing," this is the one that solves it. It runs as a separate web dashboard rather than inside the feed.
How to pick: match the tool to the job from the previous section. Content optimization starts with X's own analytics, then BlackMagic if you need real depth. Audience intelligence and relationship tracking point to BlackMagic's CRM. Real-time monitoring means X Pro, and really only if you already pay for Premium+. Account hygiene is Circleboom. Most solo creators are well served by X Analytics plus the Monday habit, and the money is better spent elsewhere.
Now notice what none of them do: write the next post. Every tool on this page measures, monitors, or manages. The distance between "threads convert best for me" and a thread actually going out on Tuesday morning is still yours to cover.
Why Replies Deserve Their Own Dashboard Tab
Here's something your analytics will show you once you start tracking profile visits by content type: replies punch above their weight.
Creators widely observe that replies are worth more of your time than they look on a dashboard. In practice, the ranking model appears to treat reply engagement, alongside reposts, quotes, dwell time, profile clicks, and follows, as one of the signals it scores posts on. So building a reply habit isn't a growth hack. It's leaning into engagement patterns that tend to matter for reach.
What this looks like practically: a thoughtful reply that makes someone stop, read your profile, and follow you works with the engagement signals that matter. A generic "great post!" doesn't. By most accounts, the replies that convert are the ones with a specific counter-take, a concrete detail, or a small story that gives the reader a reason to click through.
The problem is consistency. The first week of a reply routine feels productive. By week two, finding the right posts to reply to takes longer than writing the reply itself. Writing something that sounds like you (not a bot, not a template) takes effort. Most people abandon the habit before it compounds.
This is where Ghosti fits into the analytics loop. Your weekly review tells you that replies on certain types of accounts drive profile visits. Ghosti's Hunt Mode surfaces those high-opportunity posts in your feed so you're not scrolling aimlessly looking for them. Reply Guy generates a contextual reply so you can engage faster and more consistently.
You still review and post. But the friction that kills reply routines, finding the right post and writing something worth reading, drops to near zero.
Closing the Loop: Analytics to Output
Here's the part most analytics guides skip entirely. You found the insight. You know threads convert. You know replies on mid-sized accounts in your niche drive profile visits. You know your audience peaks between 8 and 10 AM.
Now you need to actually write the thread. Craft the reply. Show up every day. Analytics tools show you what to do. They don't do it for you.
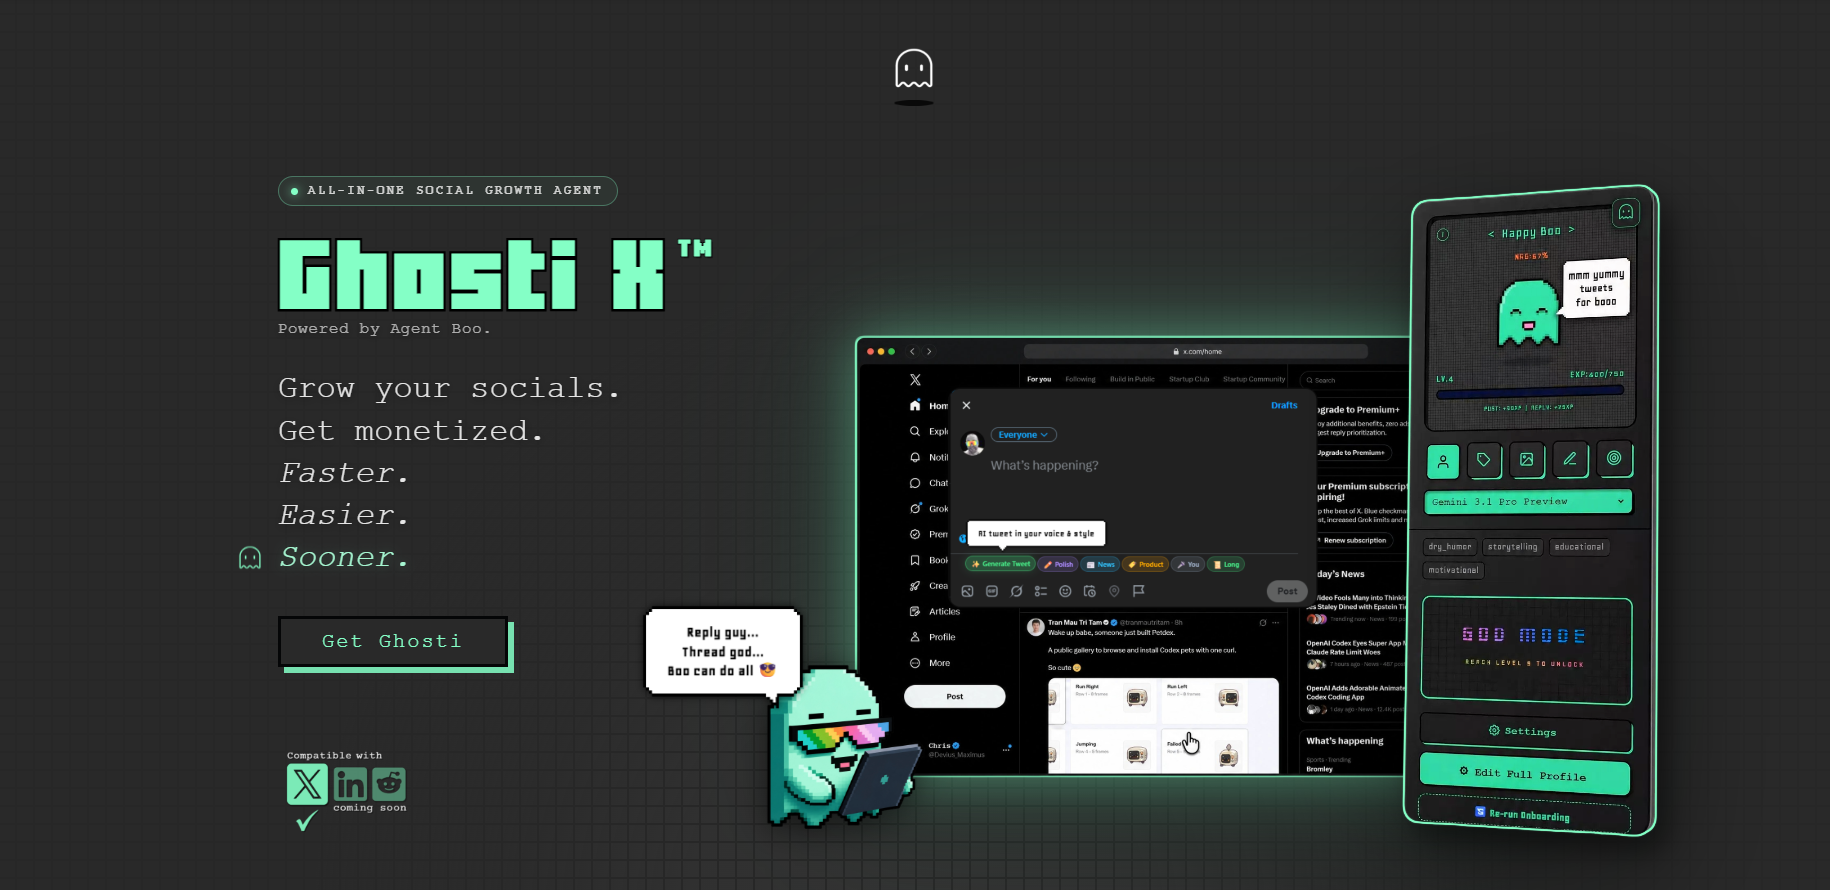
Ghosti closes that gap. It generates standalone posts, full threads, and contextual replies in your own trained voice, directly inside the X feed. No separate dashboard. No copy-pasting between a writing app and X. Your analytics tell you "more threads on AI tools in the morning." You open X, hit generate, and Ghosti writes a thread in your voice about AI tools. Review it, post it, done.
Ghosti is not an analytics tool. It is the execution layer that makes your analytics useful. Pair it with whichever analytics dashboard fits your workflow and you've got a system, not just a set of charts.
Tip: Start with X's built-in analytics and Ghosti for execution. Add a dedicated analytics platform when you need deeper audience insights that X's native dashboard can't provide.
Key takeaways
- Track profile visits and follow rate, not just impressions. These metrics show whether your content converts attention into real audience growth.
- Run a 15-minute weekly analytics review: pull top posts by profile visits, check reply performance, compare follower trends, and make one focused adjustment.
- Reply engagement is among the signals X's ranking model scores posts on, and creators widely observe that a consistent reply habit is where the time actually pays off.
- Match the tool to the job: X Analytics for the weekly review, BlackMagic for in-X depth and CRM, Circleboom for account cleanup, X Pro for live monitoring. None of them write your next post, that gap is where Ghosti fits.
Frequently asked questions
Does X have built-in analytics?
<p>Yes, and it is free. <a href="https://business.x.com/en/advertising/analytics">X Analytics</a> gives you an account overview plus post-level metrics like impressions and engagement, which is enough to run a weekly review without paying for anything. Where it falls short is connecting a specific post to the followers it earned you, and breaking performance down by post format.</p>
What is the best free Twitter (X) analytics tool?
<p>X's own built-in analytics dashboard, for most people. It is free, needs no install, and covers post-level impressions and engagement, enough to run a weekly review and spot which topics and formats pull profile visits. BlackMagic also offers a free plan with real-time in-X analytics if you want more depth than the native dashboard provides. Paid tools earn their place when you need to connect specific posts to follower growth over time, not before.</p>
What is the most important X analytics metric for creators?
<p>Profile visits relative to impressions. Impressions measure reach. Profile visits measure whether that reach pulls people toward your account. A post with modest impressions but high profile visits is outperforming a viral post that nobody clicks through on. Track the ratio over a two-week rolling window to spot which topics and formats attract your target audience.</p>
Can I use Ghosti alongside an analytics tool?
<p>Yes. Ghosti is an AI-powered Chrome extension for X that generates posts, threads, and replies directly inside the feed. Use any analytics platform to find out what content works, then use <a href="https://ghostiapp.com/">Ghosti</a> to help you produce more of it consistently. Your analytics handle the insight; Ghosti handles the output.</p>
Sources
- X Analytics, X Business (accessed July 15, 2026)
- X Open-Source Recommendation Algorithm (For You Feed) (accessed July 15, 2026)
- BlackMagic (official site) (accessed July 16, 2026)
- BlackMagic extension reviews (Chrome Web Store) (accessed July 16, 2026)
- TweetDeck / X Pro (X Help Center) (accessed July 16, 2026)
- TweetDeck (X Pro) moves behind X Premium+ (MacRumors) (accessed July 16, 2026)
- Circleboom Twitter Management (official site) (accessed July 16, 2026)
- Circleboom plans and pricing (official site) (accessed July 16, 2026)
Editorially reviewed by Chris, Ghosti Founder on .